

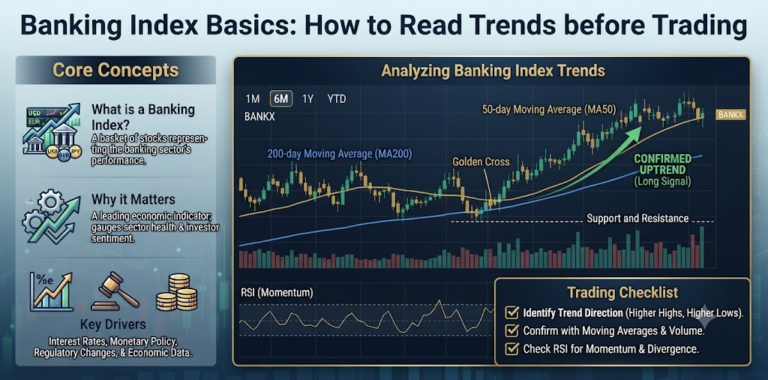
Banking index trends matter because banking stocks often reflect credit demand, liquidity, interest rate expectations, and overall market confidence. For traders, the chart is not just a price line.
It shows how institutions, retail participants, and market news are shaping direction. Reading these signals before trading helps you avoid rushed entries and understand whether the banking index is gaining strength, losing steam, or moving without clear conviction.
Price Trend
A price trend shows the broad direction in which a banking index is moving. Many traders track Bank Nifty to understand whether banking stocks are gaining strength, losing momentum or moving sideways. For someone starting to follow market movements after opening a demat account online, learning to identify the prevailing trend is more useful than reacting to every short-term change.
Traders should check whether the index is forming higher highs or lower lows, avoid making decisions based on a single candle and consider the broader market direction before responding to temporary movements. Reading the trend patiently can also reduce emotional entries during sudden spikes or declines.
Volume
Volume helps traders understand whether a price move has real participation behind it. When the Bank Nifty moves upward with strong volume, it often shows better buying interest. When the price rises but volume remains weak, the move may not have enough support.
Volume is useful because it adds depth to price action and reduces guesswork. A rising price with rising volume can show stronger participation, while a falling price with high volume may indicate heavy selling. Low volume during a breakout can also signal caution.
Support and Resistance
Support and resistance are key price levels where the banking index has reacted in the past. Support is where buying interest may appear, while resistance is where selling pressure may build. These levels do not confirm a reversal, but they help traders plan entries, exits, and risk.
Traders should mark earlier bounce or reversal points and watch price behaviour near them. A strong breakout or repeated test can make these levels more useful for trend reading before placing a trade.
Moving Averages
Moving averages smooth daily price movements and help traders identify the broader trend in a banking index. They are useful when price movement looks irregular or the trend is not clearly visible. A banking index trading above its key averages may show strength, while trading below them may suggest weakness.
Prices above moving averages can show a positive bias, while prices below them can reflect pressure. However, crossovers should always be confirmed with price action. Using more than one moving average can also help traders compare short-term and medium-term directions.
Market Sentiment
Market sentiment reflects how participants feel about banking stocks and the wider economy. Banking indices can react to interest rate views, credit growth expectations, policy updates, and global risk appetite. Sentiment is not always visible in price immediately, but it often affects how strongly trends continue or reverse.
Positive sentiment can support buying on dips, while negative sentiment can make rallies weak. News reactions should also be compared with the chart’s behaviour before concluding. Traders should avoid relying only on headlines because the actual market reaction may sometimes differ from the news expectation.
Relative Strength against the Broader Market
Relative strength shows whether the banking index is performing better or worse than the broader market. This comparison is useful because a banking index may look strong on its own but weak when compared with the wider market. Traders should check whether banking stocks are leading the move or simply following the general trend.
Outperformance may indicate stronger sector participation, while underperformance can suggest weaker interest. Comparing direction, momentum, and recovery speed can help traders read this more clearly. A stronger recovery after a market fall may show that banking stocks are attracting better demand.
Sector Performance Comparison
The banking index should be compared with other sectors to understand the broader market trend. Comparing it with other sectors helps traders understand where market money is flowing. When banking performs better than other major sectors, it may indicate stronger institutional interest.
When it lags while other sectors rise, traders should be careful before expecting a further upward move. Traders can compare banking with financial services, technology, and consumption sectors to notice which areas are attracting stronger buying. Sector rotation can change trading opportunities quickly.
Volatility and Price Momentum
Volatility shows how sharply the banking index is moving, while momentum shows the strength behind the move. High volatility can create opportunities, but it also increases risk. Strong momentum with controlled volatility is usually easier to trade than sudden, wide price swings without direction.
This is why both should be read together. Strong momentum can support trend continuation, while sudden volatility can trigger false breakouts. Traders should avoid chasing fast moves without confirmation. It is better to wait for a stable setup where the price direction, volume, and momentum support the same view.
